I contributed to the development, testing and data preparation for the project. I have extracted tractography for more than 800 subjects from Human Connectome Project data using High Performance Computing MASSIVE. Major contributions and images in this page generated by Dany Vohl, PhD student, Swinburne Univ. of Tech.
encube 1 —a qualitative, quantitative and comparative visualisation and analysis system, with application to high-resolution, immersive three-dimensional environments and desktop displays. encube extends previous comparative visualisation systems by considering: (1) the integration of comparative visualisation and analysis into a unified system; (2) the documentation of the discovery process; and (3) an approach that enables scientists to continue the research process once back at their desktop. Our solution enables tablets, smartphones or laptops to be used as interaction units for manipulating, organising, and querying data. We highlight the modularity of encube, allowing additional functionalities to be included as required.
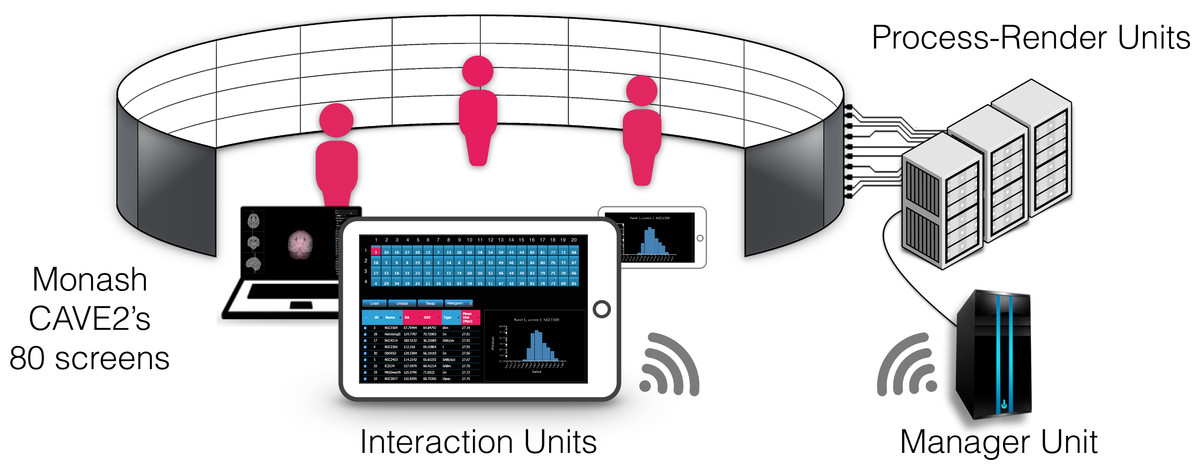
Components of encube
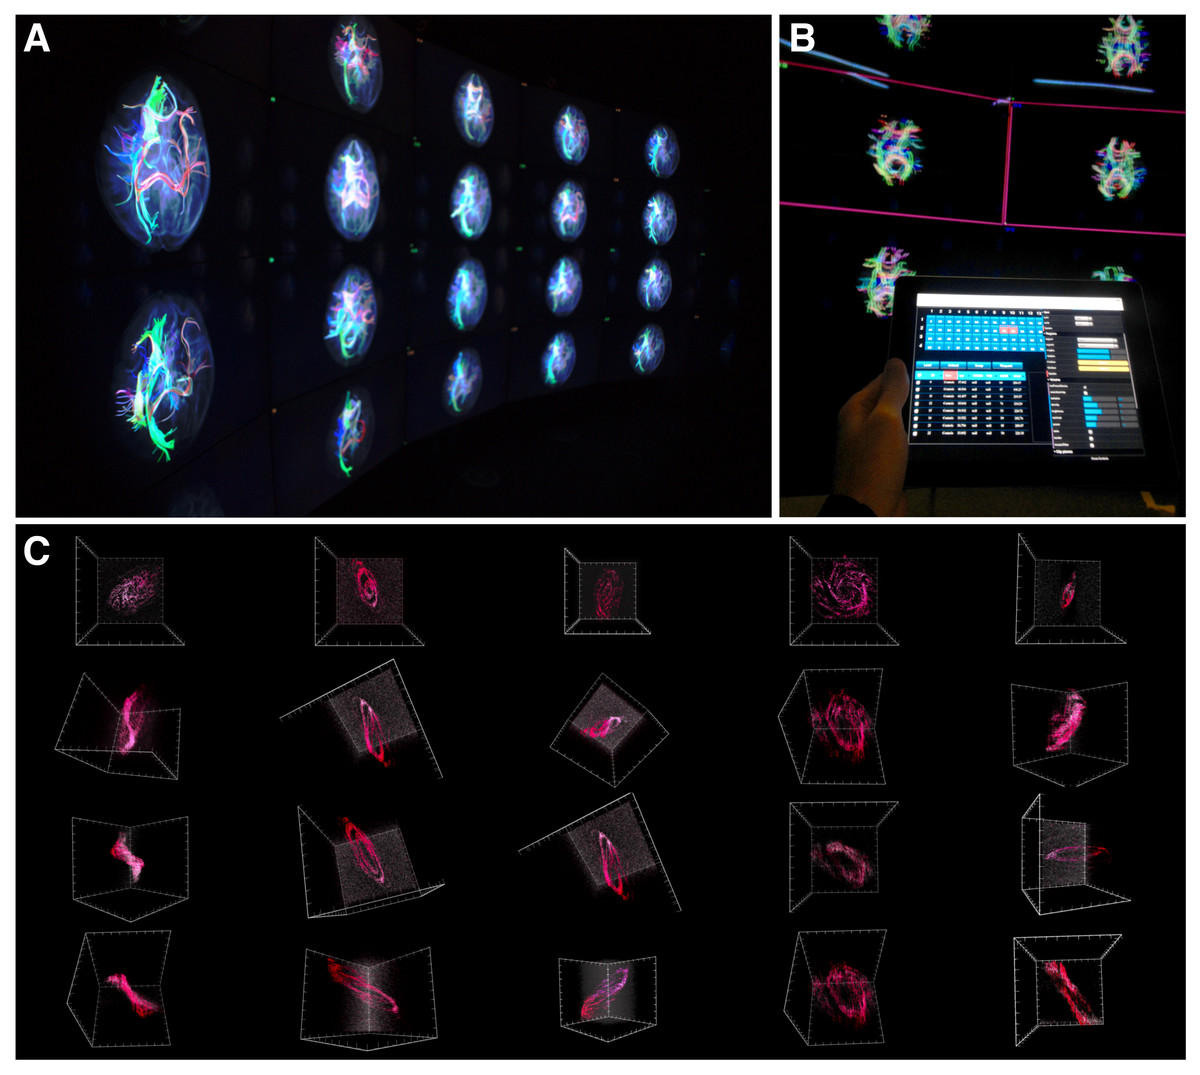
encube in action. (A) Photograph of a subset of five out of the 20 four-panel columns of the Monash CAVE2. (B) Selecting screens within the meta-controller leads to the display of a frame (pink) around the selected screens in the CAVE2. (C) Visualisation outputs showing different galaxy morphologies taken from the THINGS galaxy survey (Walter et al., 2008)
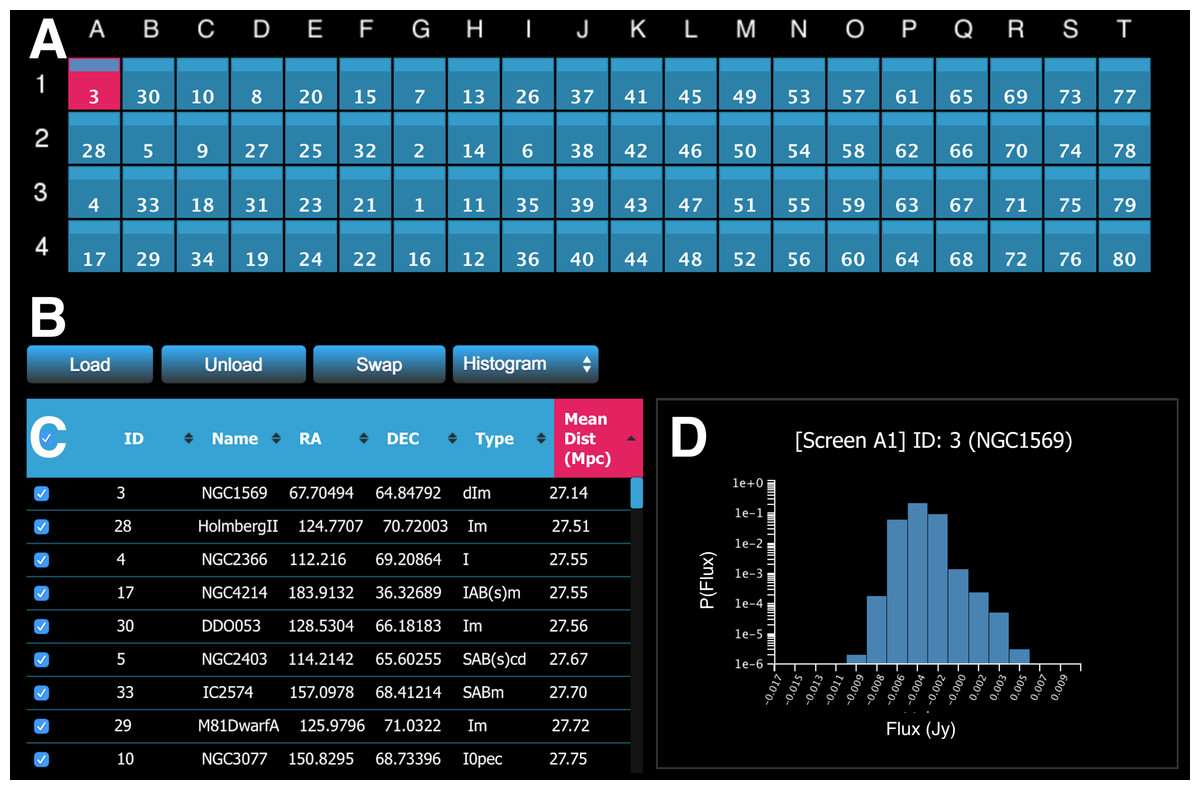
Meta controller. (A) A miniature representation of the Monash CAVE2’s 4 rows by 20 columns configuration; (B) action buttons; (C) the dataset viewer (allows the survey to be sorted by multiple criteria); and (D) request/display quantitative information about data from one or multiple screens (e.g., a histogram is shown here for galaxy NGC1569 currently on screen A1)